Explore the state-by-state map
Switch between the overall Environmental Pressure Index and the individual data points behind it. Hover or tap a state for a quick snapshot.
Top 5 states by Environmental Pressure Index
State rankings
Compare how data center development, listed species, forest cover and drought pressure shape each state’s overall score.
| Rank | State | Data Center Projects | Endangered Species | Forest Cover (%) | DSCI Score | Environmental Pressure Index |
|---|
Where the Pressure Shows Up Locally
State rankings can feel abstract, so these source-grounded examples show the kinds of local pressure behind the index. The visuals are illustrative scenarios, not documented before-and-after photography.
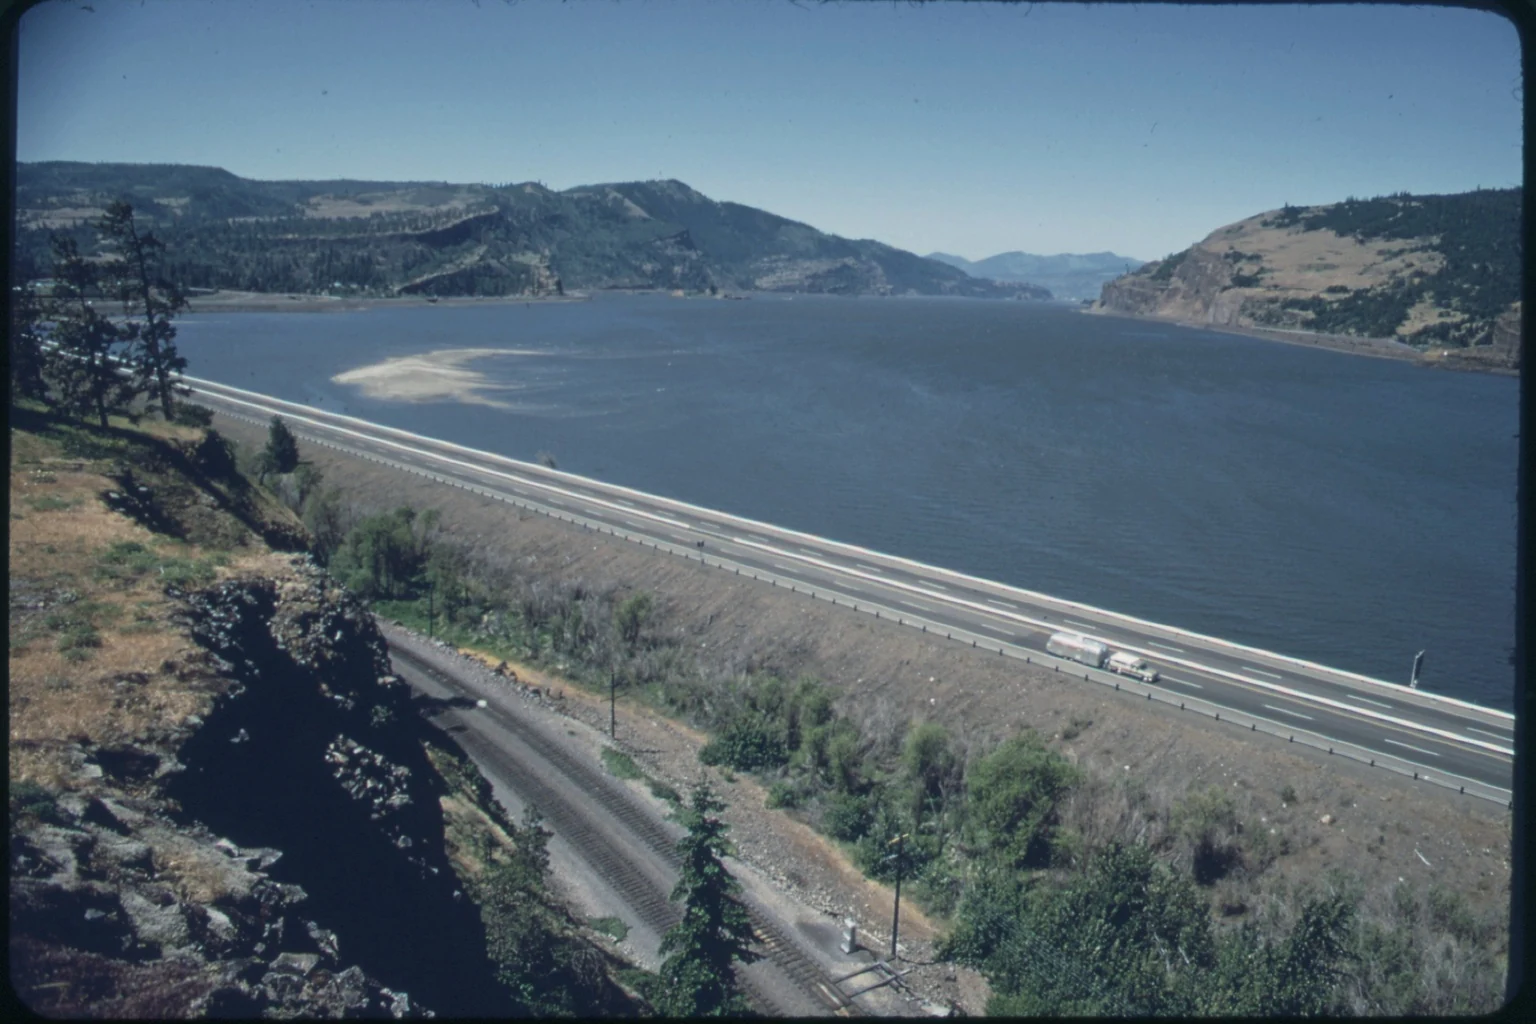
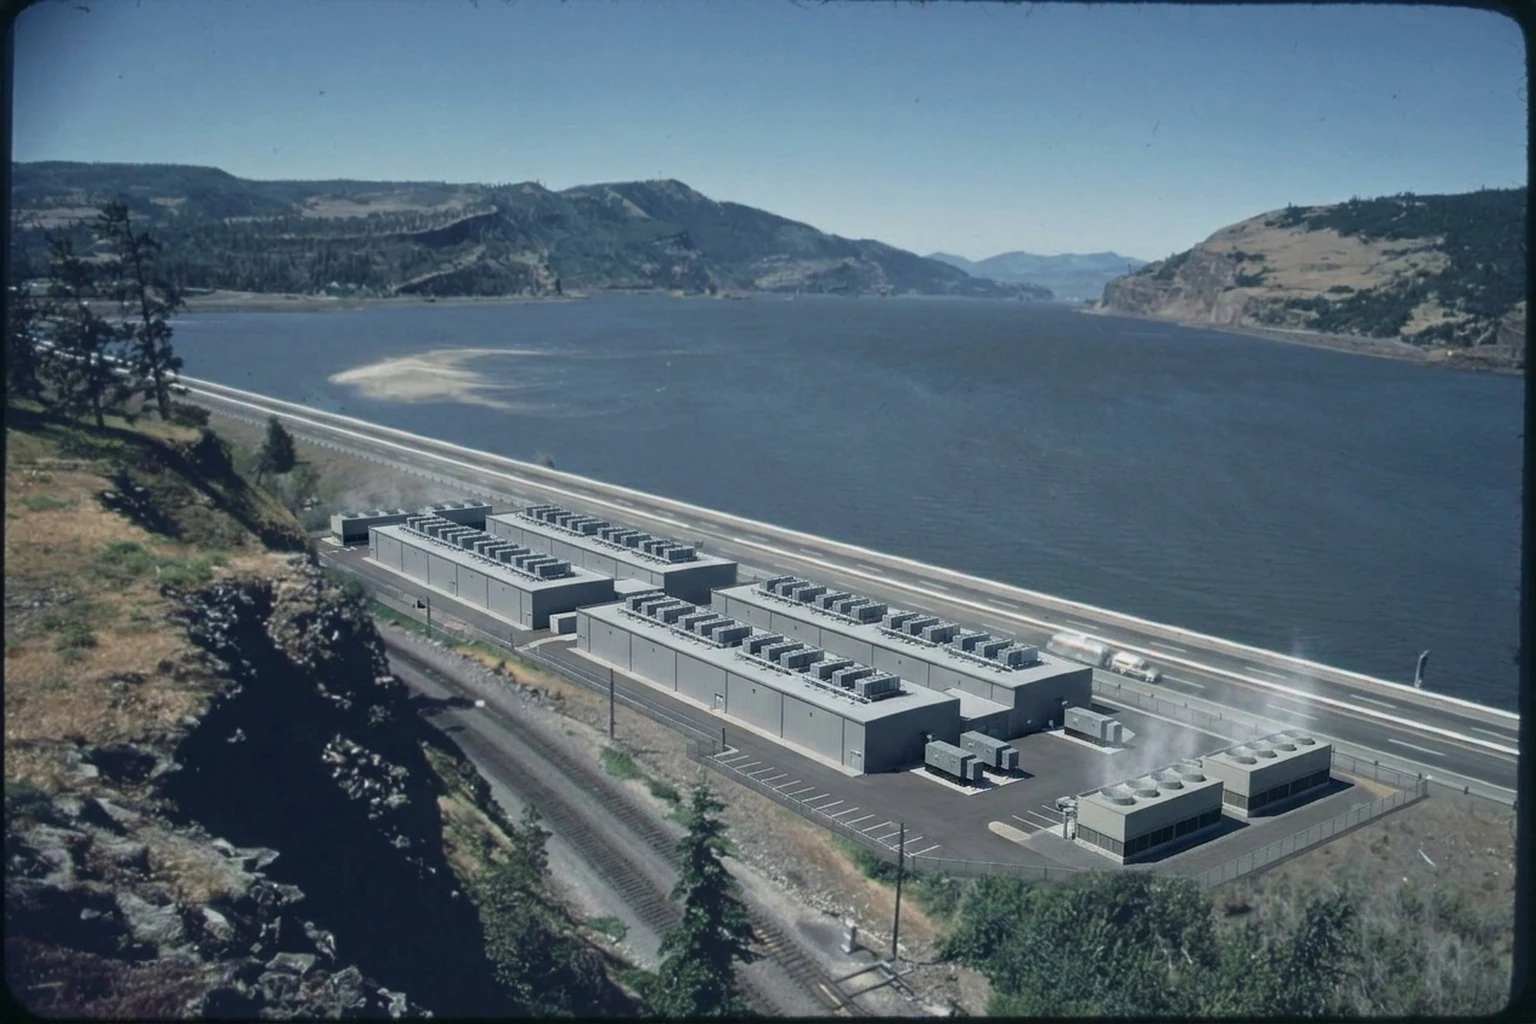
Cooling servers with local water supplies.
The Columbia River Gorge is a protected scenic corridor, and nearby data centers add major demand to local water systems. Reporting by Oregon Public Broadcasting found that one company's facilities in The Dalles used close to a third of the city's total water consumption. That demand sits alongside the water needs of farms, forests and aquatic habitat in a region already shaped by snowmelt, drought and groundwater pressure.
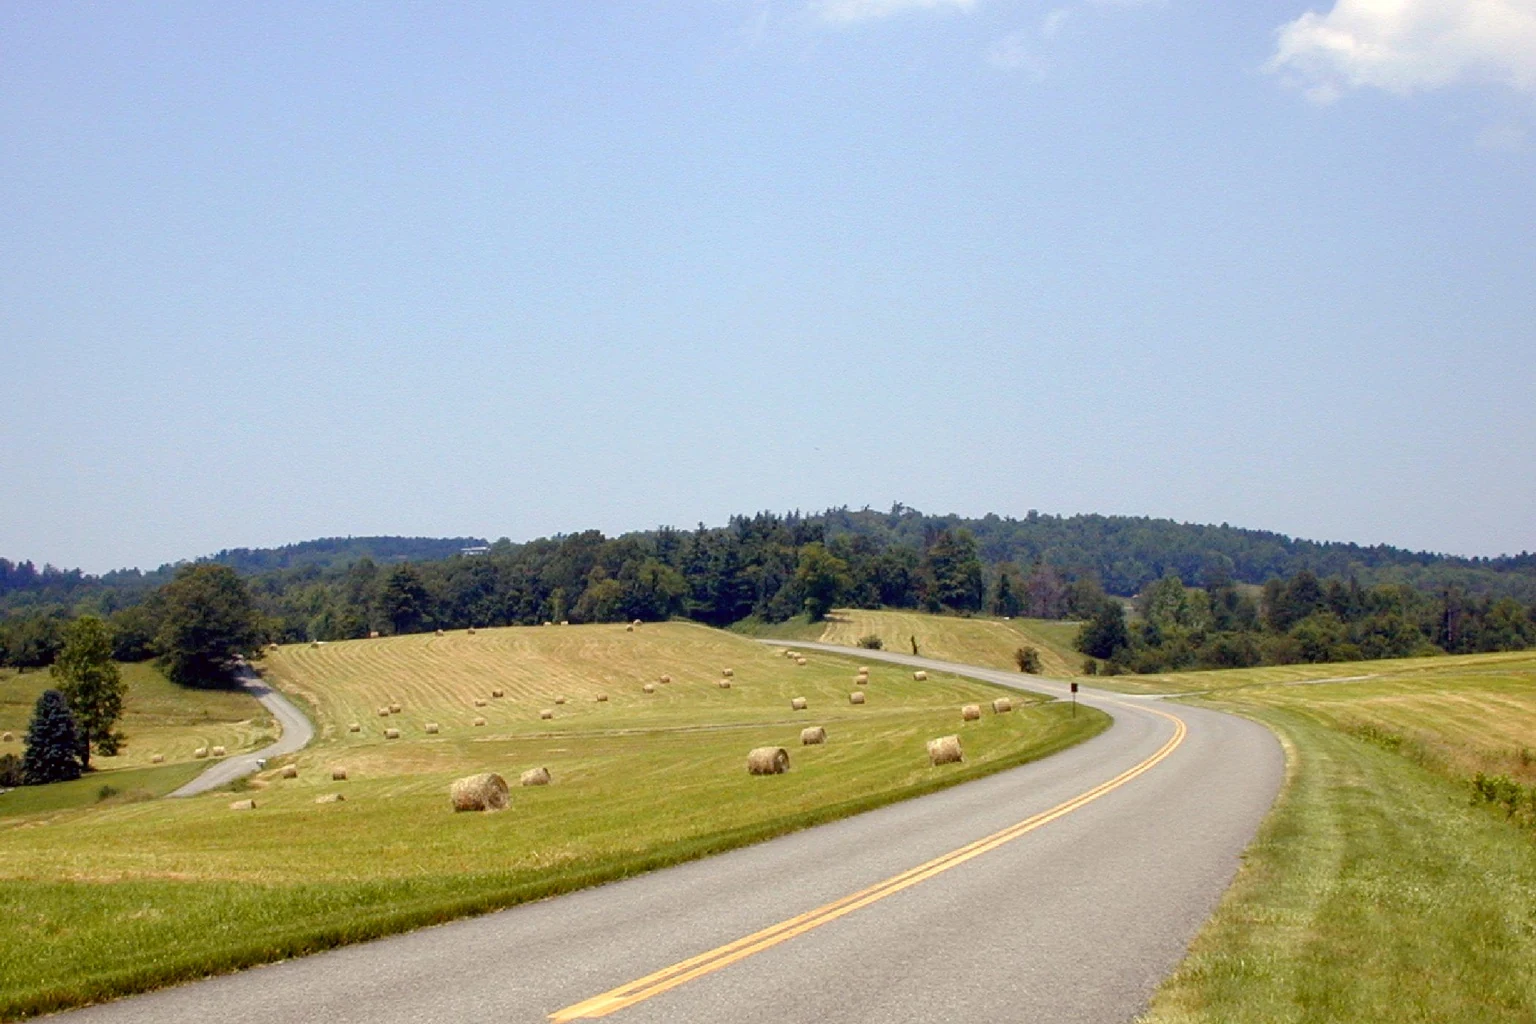
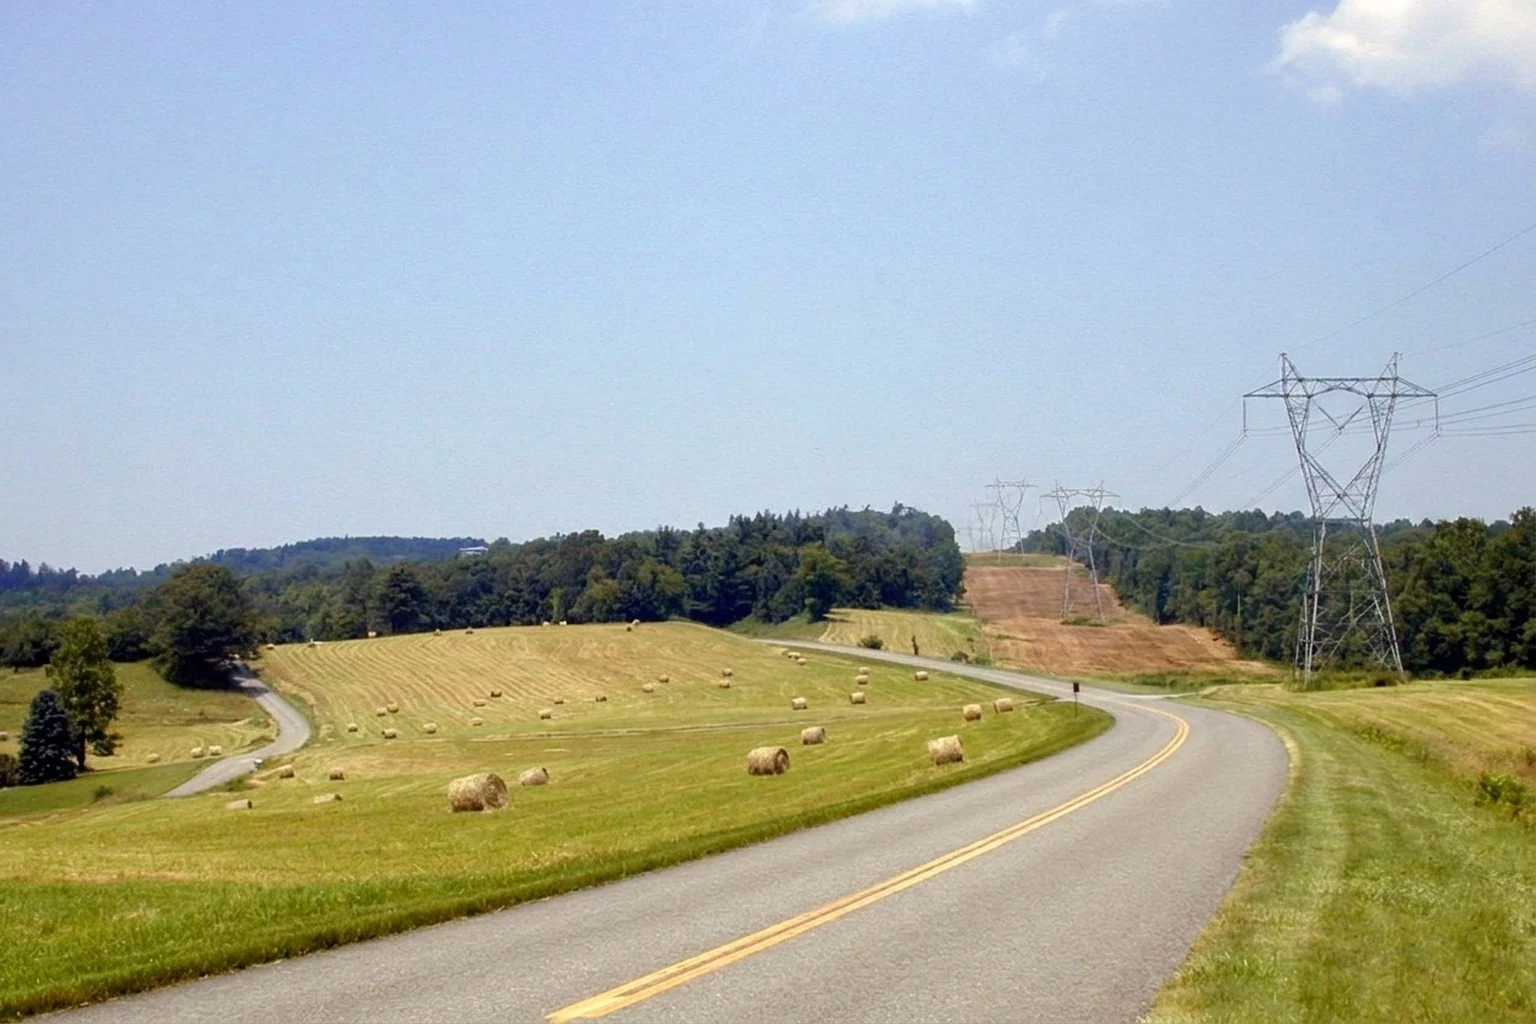
High-voltage corridors near protected landscapes.
In Virginia and the wider Mid-Atlantic, the pressure is not only from data center buildings, but from the power infrastructure needed to serve them. A 2026 report from the National Parks Conservation Association warns that proposed transmission lines, substations and towers linked to the region's data center boom could fragment habitat and bring industrial infrastructure closer to places such as Shenandoah and the Appalachian Trail.
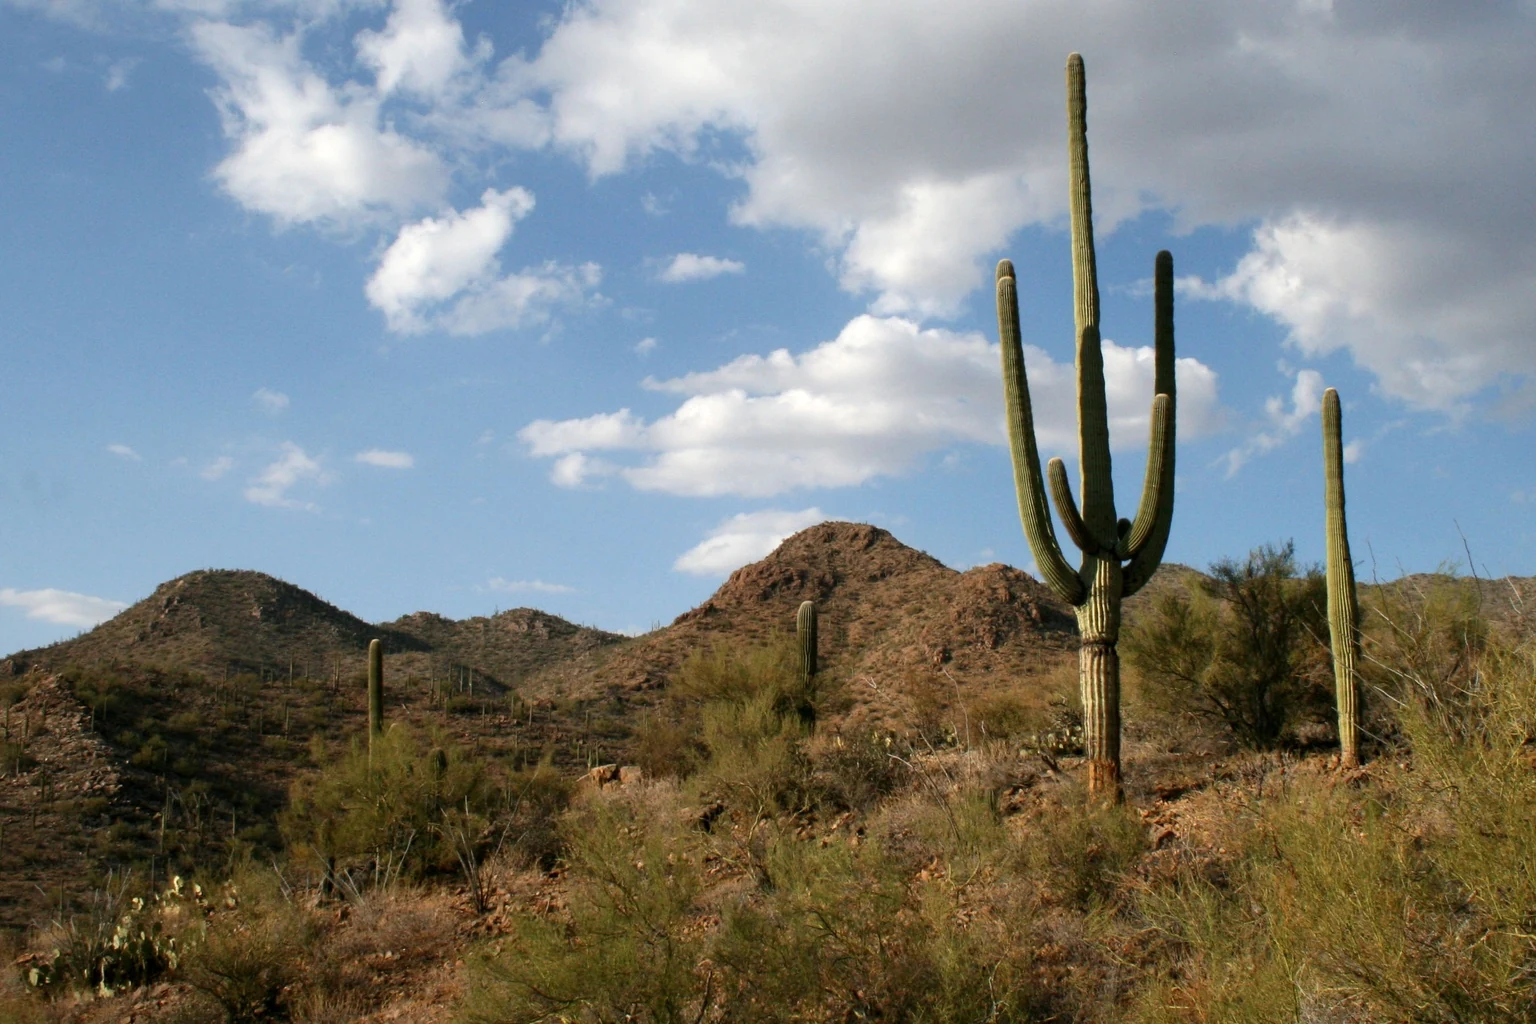

Long-term water questions on drought-stressed land.
The Sonoran Desert around Tucson supports a remarkable range of wildlife, and Arizona is already planning around drought and shrinking Colorado River supplies. Grist reports that data centers are not the main current driver of Arizona's water crisis, but their expansion is raising questions about future water allocation, power-related water demand and local planning. In Tucson, public concern over one proposed complex helped push the city council to reject it.
Methodology
Outforia created this index to compare where data center activity may overlap with existing environmental pressure at state level. The ranking combines a state-level data center development count with three environmental indicators: threatened and endangered species, forest cover and drought pressure.
What went into the index
How the score was calculated
Each input was converted to a comparable 0 to 100 scale by scaling it against the highest state value for that input. The highest state received 100, and other states were scored proportionally. The final uncapped score was then rescaled so the top-ranked state equals 100.
The three environmental indicators were weighted equally to keep the index transparent and avoid privileging one type of pressure over another. They were averaged first to create an environmental vulnerability base.
The data center score is used as a pressure multiplier because the index is designed to show where environmental vulnerability may become more exposed as new data center buildout increases. That base was then adjusted by the data center development multiplier, which raises scores where large development pipelines overlap with existing environmental pressures.
Environmental Pressure Index = environmental vulnerability base × data center development multiplier.
Sources and data dates
Unless noted otherwise, source data was compiled for this study on June 17, 2026.
- Data center projects: Data Center Map 50-state audit file, June 17, 2026. Includes entries listed as planned, under construction or land-banked, grouped by state.
- Threatened and endangered species: U.S. Fish & Wildlife Service ECOS state listing totals, compiled for this study on June 17, 2026.
- Forest cover: USDA Forest Service Forest Inventory and Analysis report, compiled for this study on June 17, 2026.
- Drought pressure: U.S. Drought Monitor Drought Severity and Coverage Index data, using the DSCI snapshot from June 9, 2026.
The ranking excludes states with no planned, under construction or land-banked facilities in the Data Center Map input. They may still have existing operating facilities. These states are shaded gray on the map: Hawaii, Massachusetts, New Hampshire, Rhode Island, and Vermont.